Music Infomatics
Date: 27/11/2024
Intention of this page is to summarize the project I carried out for the course Music Informatics. The detailed report can be found here.
Prelude
Using deep learning models to directly process a music track is challenging due to the large number of data points it contains. For instance, consider this file. The file has a sampling rate of 44100 Hz, meaning there are 44,100 data points per second. With a total duration of 51 seconds, one channel contains 2,249,100 data points. (You can use this python library to experiment with audio files.) By comparison, an image in the ImageNet dataset typically has dimensions of 224x224, amounting to 150,528 data points (considering 3 channels).
Spectrogram
Powering down your brain to the absolute minimum, if someone were asked what comes to mind when they hear time series data, I’m pretty sure they would say Fourier transform. Performing a Discrete Fourier Transform (DFT) outputs data in the Frequency-Magnitude domain (still 2D). Performing DFT on an entire file, however, would require significant computational power. Therefore, one typically uses the Short-Time Fourier Transform (STFT), which computes DFT for every pre-defined window size (usually after applying a window function, such as the Hann window). This results in 3D data, where, in addition to frequency and magnitude, there is also a time axis that indicates the start time of each window. The resulting data is called spectrogram and looks like this (taken from wikipedia)

The above can be viewed as an image, thus providing a means to loosely view an audio file as an image. Now we can bring out the big-gun Deep Learning models like Res-Net (?) or some CNN to perform whatever task we want.
Get to the point Danny
Out in the wild there are bunch of music taggers like Fully Convolutional Network, Musicnn, Convolutional Recurrent Neural Network, Self-attention based Network, Harmonic CNN, Sample-level CNN and Sample-level CNN with Squeeze and Excitation layers. But what’s tagging, welp it can be anything from genre to mood. We consider the models trained on MTG-Jamendo Dataset, which has the following tagging class:
| Genre | Instrument | Mood/Theme |
|---|---|---|
| rock | voice | film |
| pop | synthesizer | relaxing |
| classical | piano | emotional |
| popfolk | guitar | energetic |
| funk | strings | happy |
| ambient | keyboard | |
| chillout | violin | |
| downtempo | bass | |
| easylistening | computer | |
| electronic | drummachine | |
| lounge | drums | |
| triphop | electricguitar | |
| techno | acousticguitar | |
| newage | electricpiano | |
| jazz | ||
| metal | ||
| alternative | ||
| experimental | ||
| soundtrack | ||
| world | ||
| trance | ||
| orchestral | ||
| hiphop | ||
| instrumentalpop | ||
| reggae | ||
| dance | ||
| folk | ||
| poprock | ||
| indie | ||
| house | ||
| atmospheric |
Our aim is to see how well these taggers generalize. We take the help of GTZAN dataset and check if they form natural clusters without the knowledge of the true clusters:Blues, Classical, Country, Disco, Hiphop, Jazz, Metal, Pop, Reggae and Rock. Our aim is to now learn WHAT ON EARTH DO THEY LEARN?. In Academic parlance, this layer gives the representation of the input. Representation learning as they call it, is the viewpoint that all the deep learning architecture learns is ways to project highly complex data into some \(\mathbb{R}^d\) space.
Really really exciting part I
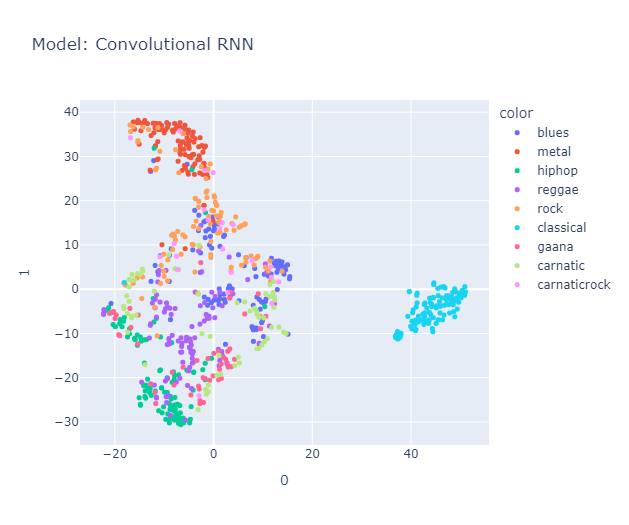
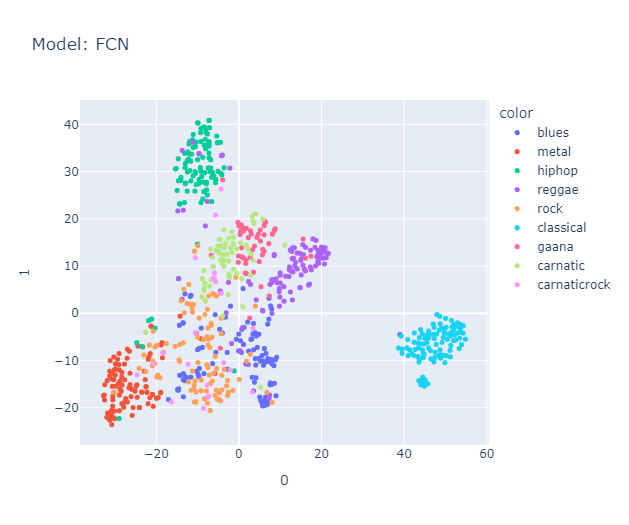
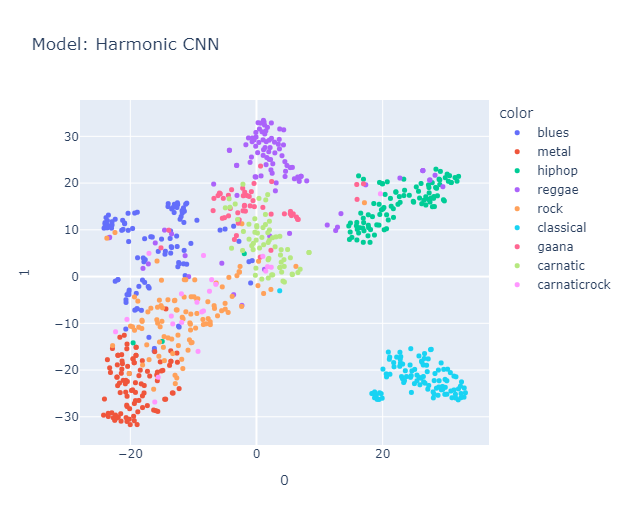
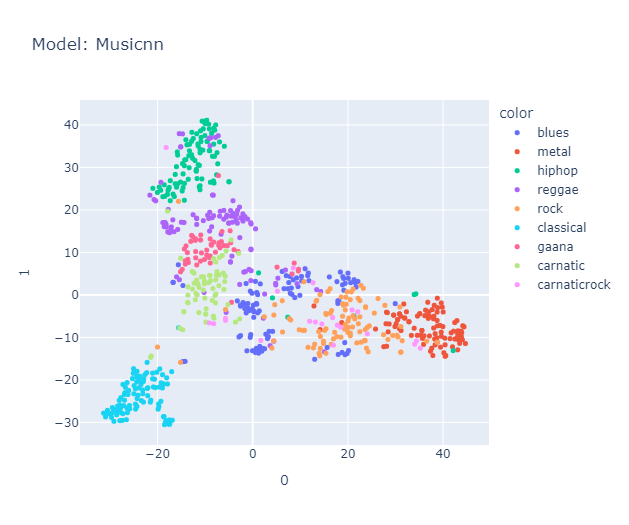
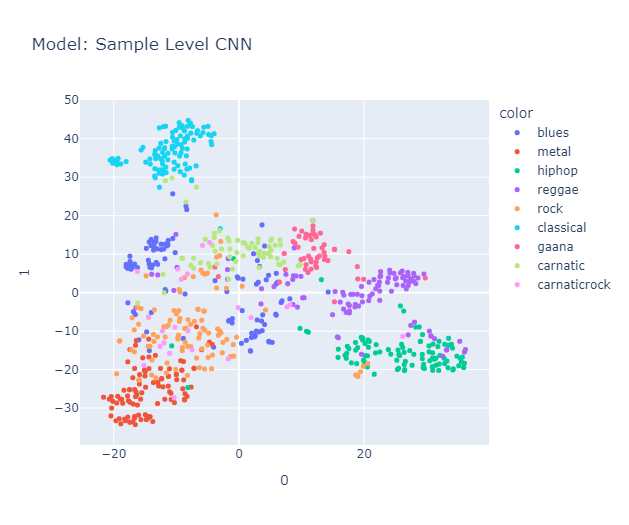
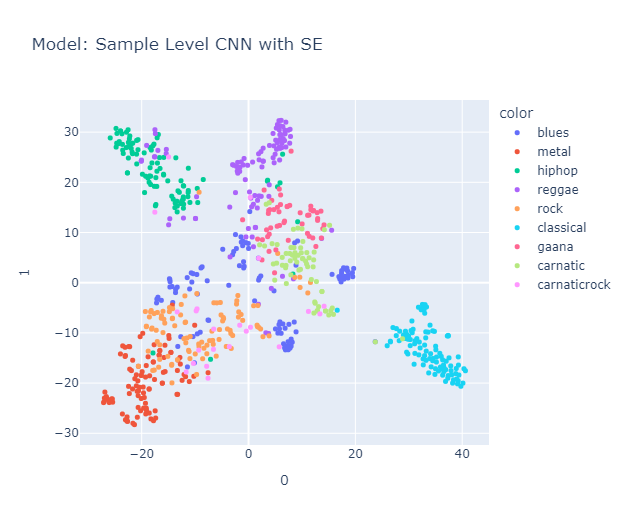
I will skip some essential yet perhaps boring details about data processing that you can find here in the methodology section. Lo and behold, the clusters formed quite nicely (Actually, maybe nicely) when projected using tSNE.
Is it just me, or do you also see a pigeon 🕊️ in the representation? It's interesting to note that the classical music cluster is farther away from the rest of the clusters. Jazz is placed close to classical in almost all the models. Blues seem to be scattered across jazz, country (Hmm, I’m not sure if this makes sense, but okay), and maybe reggae? Hip-hop and pop seem to be represented close to each other, with disco wedging in between them. Rock is placed between metal (I mean, rock and metal seem the same to me) and country. Anyway, a music anthropologist would be better equipped to judge whether this really makes sense, but it makes all the sense I need.
Interestingly, it roughly organizes these genres in a manner similar to this map.
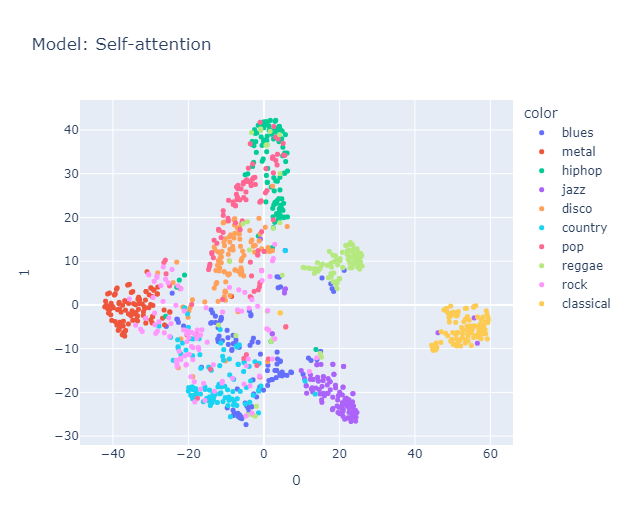
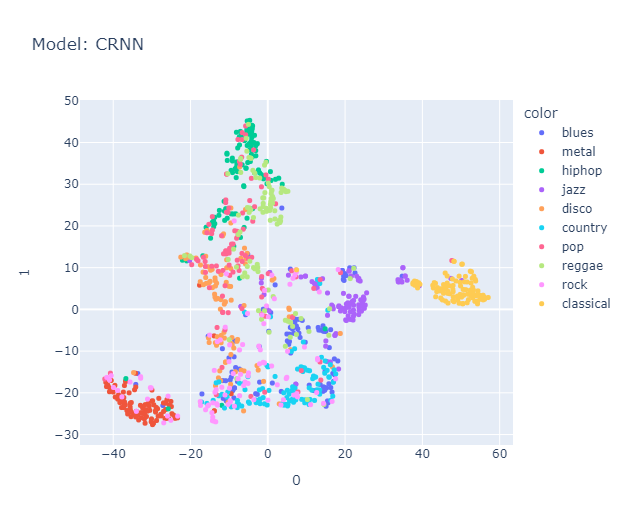
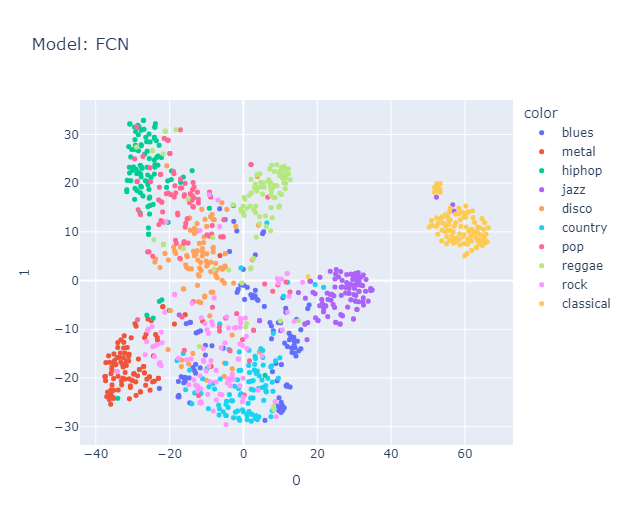
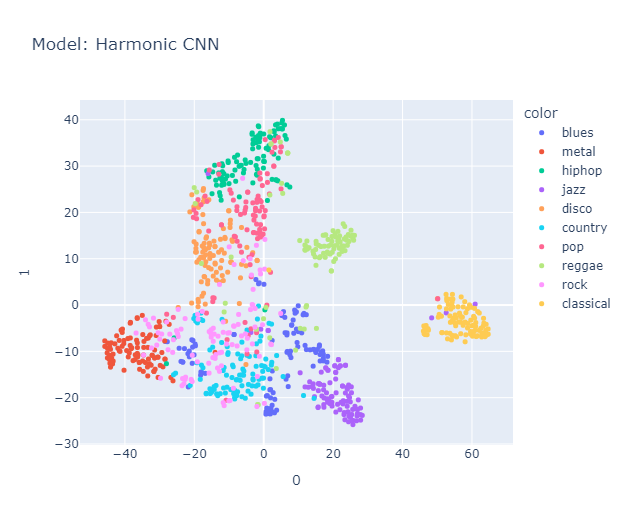
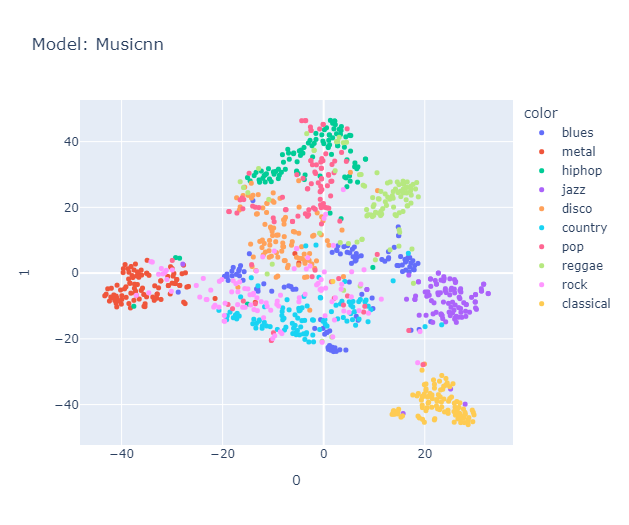
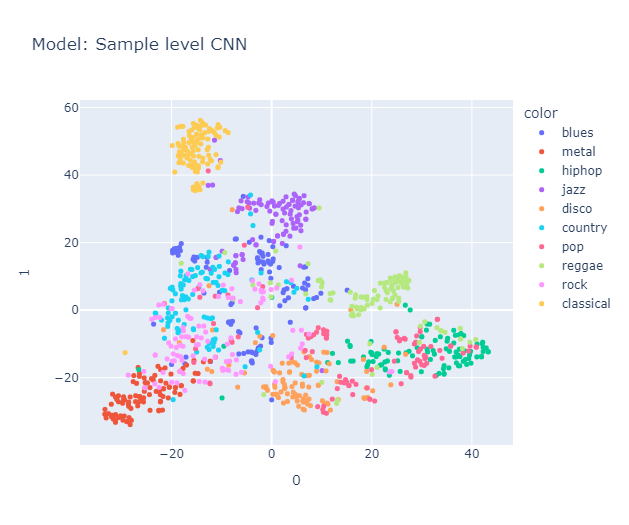
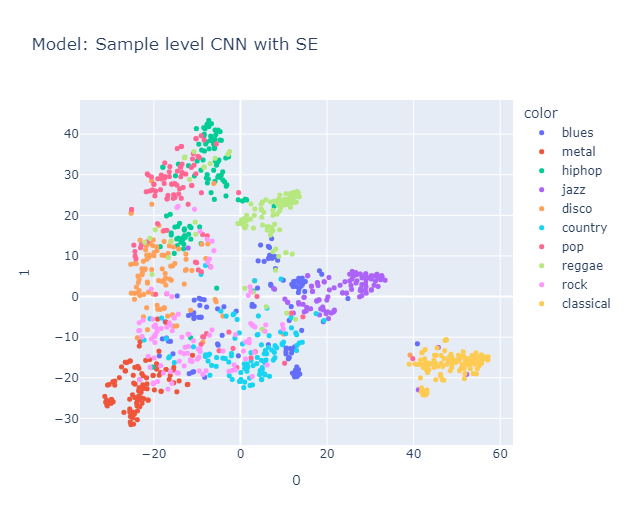
We used Hungarian algorithm to compare our clusters with true cluster. Imo, it is too boring to discuss about them here, you can find it again in the report
Really really exciting part II
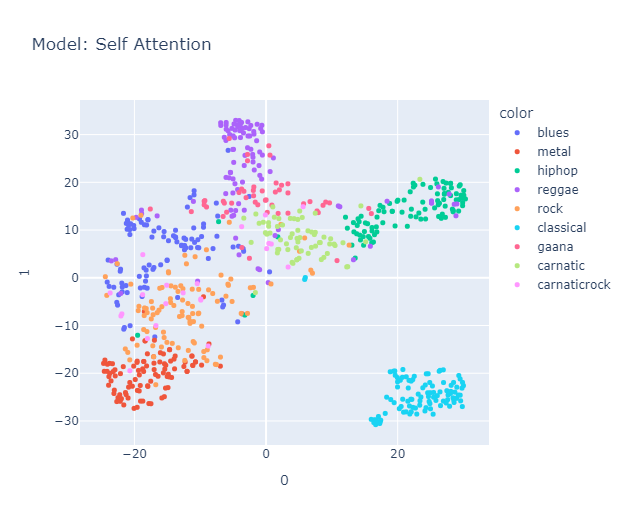
All that is fine, but what happens if we throw non-Western songs at it? Will it dodge them like Muhammad Ali?

Turns out, it still organizes them into clusters. To test this, we used Carnatic songs, Gaana songs and Carnatic-Rock. We hoped that Gaana songs would be placed near rap and/or reggae, as we felt both genres share roots in being music of the masses. Similarly, we expected Carnatic music to be close to the classical genre due to its strong emphasis on structure. And, as the name suggests, we anticipated that Carnatic Rock would fall somewhere between classical and rock music.
Carnatic formed its own cluster, closer to classical music, blues, and metal. Surprisingly, Gaana and Carnatic music are placed together (maybe due to geographic influence), and, as expected, Gaana is positioned close to reggae and hip-hop. Likewise, Carnatic Rock was placed in a space spanning both the Rock and Carnatic clusters, but in my opinion, it leans more towards rock than Carnatic.
Things we liked to explore
We wanted to explore how the one-and-only Isaignani(Maestro) Illayaraja’s songs end up in this space. But perhaps his work is best left unanalyzed—sometimes magic is better left untouched (or we didn’t have enough time 😜). Here’s a playlist to knock you off your feet.
PEACE OUT, CIAO, BYE
References
- Automatic tagging using deep convolutional neural networks
- End-to-end learning for music audio tagging at scale
- Convolutional Recurrent Neural Networks for Music Classification
- Toward Interpretable Music Tagging with Self-Attention
- Data-Driven Harmonic Filters for Audio Representation Learning
- Sample-level Deep Convolutional Neural Networks for Music Auto-tagging Using Raw Waveforms
- Sample-level CNN Architectures for Music Auto-tagging Using Raw Waveforms